
Automating service configurations with NixOS
Using Nix to bootstrap and deploy services and their connectivity.
In my last post I mentioned that I use a “service catalog” as a source of truth for what is deployed where and how it should be configured. This catalog is read by a number of services to determine the locations of those services so that can be referred back to.
NixOS makes it easy to get services up and running with sensible defaults. But once those services are online we need a means of routing traffic to them from a nice domain (e.g. service_name.svc.joannet.casa), and monitoring against the service to alert when it’s down.
Since NixOS manages the services and their configuration, we can have it create configurations for services that enable connectivity.
For my use case the tasks it performs are:
- DNS rewrites to forward DNS names to the node hosting the service
- I use AdGuardHome as my DNS server, so it generates the config for
- Reverse proxy the service to the port the service runs on the host
- Each host has a Caddy instance deployed to it, which reverse proxies all the services that run on that host
- Caddy needs to be aware of the domain to forward traffic to, at the particular port
- Dashy for the home dashboard
- A dashboard which let’s you create bookmarks, and more
- Monitoring service endpoints
- We want to be informed when services go down, so we can automate writing the Prometheus blackbox exporter config - scraped by VictoriaMetrics
- Then there is a Grafana alert which is configured to alert when the probe fails
When I add a new service to the catalog and deploy the NixOS configs to the nodes, all the above is taken care of for me.
Catalog definitions
In catalog.nix, there is an attribute called services which is an attribute set (attrset) of service names to its service definition. The service name is what Caddy and AdGuardHome will assume to be the domain name to forward requests to, although with an option to make this configurable.
Also in catalog.nix is another attribute nodes which maps hostnames to node definitions. Service definitions in their current form are dependent on node definitions, so let’s dive into the latter first.
Node definitions
A node definition has these attributes:
ip.private- private IP address
ip.tailscale- Tailscale IP address
- Not currently used yet, but will look to add functionality when I want to set up connectivity to the services over Tailscale
system- What architecture the host is on
- Used to determine what flavour of nixpkgs should be used
isNixOS- boolean representing if this is running NixOS, as I have some legacy hosts which are not yet migrated over
nixosHardware- optional; any nixos-hardware modules to include into the configuration too
Let’s see an example node definition for the dee host.
nodesBase = {
    dee = {
      ip.private = "192.168.1.10";
      ip.tailscale = "100.127.189.33";
      system = "aarch64-linux";
      isNixOS = true;
      nixosHardware = nixos-hardware.nixosModules.raspberry-pi-4;
    };
};
You’ll notice node definitions are defined under nodesBase , this is because I want nodes to have the hostname enriched in each node definition at hostName. We’re already defining the hostname as the attribute name, we can follow the Don’t Repeat Yourself (DRY) principle by doing some Nixlang work:
  nodes = builtins.listToAttrs (map (hostName: {
    name = hostName;
    value = (nodesBase."${hostName}" // { hostName = hostName; });
  }) (builtins.attrNames nodesBase));
From my Nixlang cheatsheet, we can [[#Add an attribute to an attrset]] to enrich each base node definition with the hostName (the attribute name of nodesBase), and then [[#Converting a list to attributes|convert the returned list to an attrset]]. After this a subset of nodes would be equal to:
nodes = {
    dee = {
      hostName = "dee";
      ip.private = "192.168.1.10";
      ip.tailscale = "100.127.189.33";
      system = "aarch64-linux";
      isNixOS = true;
      nixosHardware = nixos-hardware.nixosModules.raspberry-pi-4;
    };

    # ... remaining nodes here
};
Service definitions
The service definition accepts these attributes:
host- The node that runs this service
port- The port this service runs at
blackbox.name- The display name to use for this service for blackbox
- For when the domain name doesn’t map to the service name
- i.e. the Dashy service is reachable at
home.svc.joannet.casa, but we want blackbox to announce the service asdashy
- i.e. the Dashy service is reachable at
blackbox.path- Blackbox by default will take the root domain name as the health check endpoint. If that should not the case then you can add a suffix path here
- e.g.
/health
caddify.enable- Whether Caddy which runs on the same host should reverse proxy to this service at the port defined
caddify.skip_tls_verify- Whether Caddy should ignore TLS verification when forwarding traffic to this service
- Usually for when the backend service defaults to HTTPS, and I cba to set up a certificate trust
caddify.forwardTo- Define a node here different to the host to have that node set up reverse proxy instead
- Currently I’m using this to reverse proxy for services where nodes do not have Caddy on them (i.e. non-NixOS nodes)
caddify.paths- A list of paths, additional path forwarding to ports that
- Used this for testing path forwarding for minio console, but reverted as it didn’t play nice - I’m not using this for anything right now
path- The URL path to forward (e.g.
/ui/*)
- The URL path to forward (e.g.
port- The port to forward to
dashy.section- What section in Dashy it should fall under
dashy.description- The description to use in Dashy
dashy.icon- The icon to display in Dashy
An example service definition would look like this.
servicesBase = {
    adguard = {
      host = nodes.dee;
      port = 3000;
      caddify.enable = true;
      dashy.section = "networks";
      dashy.description = "DNS resolver";
      dashy.icon = "hl-adguardhome";
    };
};
So this will set for us the following:
- DNS entry in AdGuardHome for
adguard.svc.joannet.casa, which creates an A record to the private IP address of hostdee - Configures Caddy on
deeto reverse proxy traffic received onadguard.svc.joannet.casaand forward it to127.0.0.1:3000- Because I’m using Caddy, I get HTTPS for free
- Creates an entry in Dashy, in the section
networkswith the provided description and gives it a pretty icon
Additionally, the AdGuardHome module will use the port configured at the port to use when starting the service, meaning that I don’t duplicate the port (DRY principle again).
services.adguardhome = {
  enable = true;
  settings = {
    bind_port = catalog.services.adguard.port;
    # ...
  };
};
Similarly to nodes, I add the service name into the definition by duplicating servicesBase to services:
services = builtins.listToAttrs (map (serviceName: {
  name = serviceName;
  value = (servicesBase."${serviceName}" // { name = serviceName; });
}) (builtins.attrNames servicesBase));
Reading catalog definitions
To generate the configs for each service, we have to parse the contents of catalog.nix using Nixlang (have you seen the cheat sheet?).
DNS rewrites
tl;dr: See here for the configuration in GitHub.
AdGuard can respond to DNS requests by answering an IP address for it. The configuration for this is structured like so:
dns:
  rewrites:
    - domain: service.DOMAIN
      answer: IP_ADDRESS
We can use Nix to build this configuration for us.
In my module for DNS, we start by retrieving all services that should be behind Caddy using filterAttrs, and then converting to a list by passing that output to attrValues.
  # Get services which are being served by caddy
  caddy_services = attrValues (filterAttrs (svc_name: svc_def:
    svc_def ? "caddify" && svc_def.caddify ? "enable" && svc_def.caddify.enable)
    catalog.services);
filterAttrs takes two arguments, a lambda to filter the attributes by, and the attrset to filter.
Taking what we learnt about lambdas, we know that the filtering lambda takes two parameters (svc_name and svc_def), and evaluates the body of svc_def ? "caddify" && svc_def.caddify ? "enable" && svc_def.caddify.enable. Since the caddify field in the service definition is optional, we can use shorthand to determine if the field is present in the attribute (svc_def ? "caddify" and svc_def.caddify ? "enable").
When learning new languages I like to make comparisons to other languages so that we can see what’s happening - the equivalent for above would look like this in Python.
caddy_services = {}
for svc_name, svc_def in catalog_services.items():
  if "caddify" in svc_def \
      and "enable" in svc_def["caddify"] \
      and svc_def["caddify"]["enable"]:
    caddy_services[svc_name] = svc_def

# For any Python comprehension fans
caddy_services = {
  svc_name: svc_def
  for svc_name, svc_def in catalog_services.items()
  if "caddify" in svc_def
    and "enable" in svc_def["caddify"]
    and svc_def["caddify"]["enable"]
}
filterAttrs returns us an attrset, whereas we’d like a list so that we can map over each element. We can call attrValues to retrieve the list of values that make up this attrset. It the same as if we were to call caddy_services.values() in Python.
We now need to define a function which will help us to determine the IP address that the domain should be forwarded to. The service definition contains a host attribute which is set to a node definition, however there are some services at home which are not running NixOS and so won’t have Caddy.
For these services they should be routed to a host which does have Caddy, and this is what the caddify.forwardTo is for. We can write a lambda that will return the correct node definition if this attribute exists in the service definition:
getCaddyDestination = service:
  if service.caddify ? "forwardTo" then
    service.caddify.forwardTo
  else
    service.host;
This function is used when we map over caddy_services to generate the attrset containing domain and answer - the format for AdGuard to perform DNS rewrites. As getCaddyDestination returns us a node definition, we can traverse it to retrieve the private IP address.
rewrites = map (service: {
  domain = "${service.name}.svc.joannet.casa";
  answer = (getCaddyDestination service).ip.private;
}) caddy_services;
The last thing we need to do is refer to rewrites when we write the config for AdGuard.
Caddy config
tl;dr: See here for the configuration in GitHub.
Once DNS is configured, any DNS requests for service.svc.joannet.casa will be answered with the IP address of the reverse proxy (Caddy) that can serve that request, so let’s configure Caddy on how to handle that request.
My setup is probably more complex than what’s needed, since Caddy requires config for services running on the same host, as well as any additional services it should forward to other hosts. For the sake of brevity I’ll focus on the former, since the latter is done in a similar manner (look for forward_services and forward_routes).
I use the JSON structure to configure Caddy, since I’m generating these programatically. The config that we want generated for the services is in this format:
{
  "apps": {
    "http": {
      "servers": {
        "srv0": {
          "listen": [":443"],
          "routes": [
            {
              "match": [
                {
                  "host": ["service.svc.joannet.casa"]
                }
              ],
              "terminal": true,
              "handle": [
                {
                  "handler": "subroute",
                  "routes": [
                    {
                      "handle": [
                        {
                          "handler": "reverse_proxy",
                          "upstreams": [
                            {
                              "dial": "localhost:PORT"
                            }
                          ]
                        }
                      ]
                    }
                  ]
                }
              ]
            }
            // ... other services here
          ]
        }
      }
    }
  },
  "tls": {
    "automation": {
      "policies": [
        {
          "subjects": [
            "service.svc.joannet.casa"
            // ... other services here
          ],
          "issuers": [
            // ... removed for brevity
          ]
        }
      ]
    }
  }
}
That’s a lot of nesting - no wonder why they encourage using a Caddyfile instead - infact here is the Caddyfile I used before I migrated to this.
I could template the config for that instead, however I wanted to play around with learning how to manipulate attrsets, since this is how the majority of options are configured in Nix.
For each service, we need to create a route:
{
  "match": [{
    "host": [ "service.svc.joannet.casa" ]
  }],
  "terminal": true,
  "handle": [{
    "handler": "subroute",
    "routes": [{
      "handle": [
        // ... insert route handler
      ]
    }]
  }]
},
Route functions
Translating this to a function yields this result.
route = { name, port, upstream ? "localhost", skip_tls_verify ? false
  , paths ? [ ] }:
  let
    subroutes = map (service: routeHandler service) (paths ++ [{
      port = port;
      upstream = upstream;
      skip_tls_verify = skip_tls_verify;
    }]);

  in {
    match = [{ host = [ "${name}.svc.joannet.casa" ]; }];
    terminal = true;
    handle = [{
      handler = "subroute";
      routes = subroutes;
    }];
  };
route becomes a function which takes in an attrset with these parameters:
port- the service port to reverse proxy the request to
upstream- IP address to forward the request to, defaults to
localhost
- IP address to forward the request to, defaults to
skip_tls_verify- whether to ignore TLS certificate verification, defaults to
false
- whether to ignore TLS certificate verification, defaults to
path- whether any query paths should be used instead of the domain
- i.e. forward to
/pathinstead of/
- i.e. forward to
- whether any query paths should be used instead of the domain
After then within the let block we can create some local variables. In subroutes we’re mapping over the parameters and creating a routeHandler from them (shown below). Since any defined path forwarding must take precedence, it is prepended to the base path handler.
Then in the return block we return a route entry for this service. Within handle[0].routes we need a “route handler”, this can take different formats depending on whether you want to disable verification of TLS connections to the upstream service:
{
  "handler": "reverse_proxy",
  "upstreams": [
    {
      "dial": "localhost:PORT"
    }
  ],
  // optional below, to disable TLS verification
  "transport": {
    "protocol": "http",
    "tls": {
      "insecure_skip_verify": true
    }
  }
}
We can write a function that can output this for us:
routeHandler =
  { port, upstream ? "localhost", skip_tls_verify ? false, path ? [ ] }:
  let
    base_handle = {
      handler = "reverse_proxy";
      upstreams = [{ dial = "${upstream}:${toString port}"; }];
    };
    handle = base_handle // optionalAttrs (skip_tls_verify) {
      transport = {
        protocol = "http";
        tls.insecure_skip_verify = true;
      };
    };
  in {
    handle = [ handle ];
  } // optionalAttrs (length path > 0) { match = [{ path = path; }]; };
The routeHandler function this takes the same parameters as the route function. We know that each route handler needs at least a handler and upstreams, so let’s define them in the local variable base_handle.
Then if skip_tls_verify is true, we want to append on the transport block - this is making use of the merge attrset shorthand // to do this.
In the return block, we’re returning a attrset with the newly created route handler. Optionally if any additional paths were defined then add a match block to them too.
Constructing Caddy config
To start, we need to pull the services from catalog that are being hosted on this node, then convert it to a list.
host_services = attrValues (filterAttrs (svc_name: svc_def:
  svc_def ? "host" && svc_def.host.hostName == config.networking.hostName
  && svc_def.caddify.enable) catalog.services);
For each service we want to generate a Caddy route for it, using our route function from earlier.
catalog_routes = map (service:
  route {
    name = service.name;
    port = service.port;
    skip_tls_verify = service.caddify ? "skip_tls_verify"
      && service.caddify.skip_tls_verify;
    paths = optionals (service.caddify ? "paths") service.caddify.paths;
  }) host_services;
Then the last thing we need is the list of the domains that can be used for tls.automation.policies[0].subjects.
subject_names = map (service: "${service.name}.svc.joannet.casa")
    (host_services);
Now we can declare these variables in the Caddy service options:
services.caddy = {
  # ... removed for brevity

  configFile = pkgs.writeText "Caddyfile" (builtins.toJSON {
    logging.logs.default.level = "ERROR";
    apps = {
      http.servers.srv0 = {
        listen = [ ":443" ];
        routes = catalog_routes;
      };
      tls.automation.policies = [{
        subjects = subject_names;
        issuers = [
          {
            module = "acme";
            ca = "https://acme-v02.api.letsencrypt.org/directory";
            challenges.dns.provider = {
              name = "cloudflare";
              api_token = "{env.CLOUDFLARE_API_TOKEN}";
            };
          }
          {
            module = "zerossl";
            ca = "https://acme-v02.api.letsencrypt.org/directory";
            challenges.dns.provider = {
              name = "cloudflare";
              api_token = "{env.CLOUDFLARE_API_TOKEN}";
            };
          }
        ];
      }];
    };
  });
};
I’m using agenix to expose my Cloudflare token in Caddys environment variables.
After this is deployed, we will now be able to access services at easy to remember domain names, forwarded to the host on the network.
Monitoring
tl;dr: See here for the configuration in GitHub.
To monitor the services I’m using the Prometheus blackbox exporter - a big thanks to maxanderson’s internetmonitoring for the inspiration.
Blackbox has a multitude of probes you can use - for our use case we want to use the http probe, which returns the HTTP response code, probe duration, and also returns info on TLS certificates.
Blackbox configuration
Given we can build a list of services, we want to write configuration that blackbox can parse to probe these. We can pass a target list of the format:
# format
url;human_name;routing

# examples
https://service_name.svc.joannet.casa;service_name;internal
https://grafana.svc.joannet.casa;grafana;internal
https://loki.svc.joannet.casa/ready;loki;internal
https://bbc.co.uk;bbc.co.uk;external
https://jdheyburn.co.uk;jdheyburn.co.uk;external
url is the endpoint that the probe should hit, followed by a human_name which allows us to make it easily identifiable when querying/alerting, and lastly a routing which can be one of internal or external - which we can use to filter metrics on later.
We can then use Prometheus’s relabel configs to parse these and map them to labels in the probe. So let’s get building by first building the list of services as we’ve done so previously.
caddified_services = attrValues (filterAttrs
  (svc_name: svc_def: svc_def ? "caddify" && svc_def.caddify.enable)
  catalog.services);
And now map these services into the desired format of url;human_name;routing.
internal_https_targets = let
  getPath = service:
    optionalString (service ? "blackbox" && service.blackbox ? "path")
    service.blackbox.path;
  getHumanName = service:
    if service ? "blackbox" && service.blackbox ? "name" then
      service.blackbox.name
    else
      service.name;
in map (service:
  "https://${service.name}.svc.joannet.casa${getPath service};${
    getHumanName service
  };internal") caddified_services;
let blocks can be used in Nix to define local variables when assigning statements (I’ve used them previously in functions). I’m defining two functions in this block, getPath and getHumanName.
getPath checks to see if there is a health check path to append to the service URL, because the health check endpoint may not necessarily be at the root path (/) as we see for the case of Loki (/ready). So we perform a look up to see if a path is defined in the service definition, else we don’t append one (optionalString will return an empty string ("") if the condition is false).
getHumanName checks to see if there’s a human name we should override with, else the default service name is used. This is useful where the domain name doesn’t necessarily map to the service that underlines it, such as home.svc.joannet.casa is the service dashy - this override prevents the human name being set as home.
Blackbox can be used to monitor any endpoint. It can be useful to have it monitor endpoints external to my local services so that I can ensure my Internet is connected. Let’s create that list and merge it with our internal targets.
external_targets = map (url: "https://${url};${url};external") [
  "bbc.co.uk"
  "github.com"
  "google.com"
  "jdheyburn.co.uk"
];

# concatenate the two together
blackbox.https_targets = external_targets ++ internal_https_targets;
Now we need to define some relabelling so that blackbox knows how to parse it.
blackbox.relabel_configs = [
  {
    source_labels = [ "__address__" ];
    regex = "(.*);(.*);(.*)"; # first is the url, thus unique for instance
    target_label = "instance";
    replacement = "$1";
  }
  {
    source_labels = [ "__address__" ];
    regex = "(.*);(.*);(.*)"; # second is humanname to use in charts
    target_label = "humanname";
    replacement = "$2";
  }
  {
    source_labels = [ "__address__" ];
    regex =
      "(.*);(.*);(.*)"; # third state whether this is testing external or internal network
    target_label = "routing";
    replacement = "$3";
  }
  {
    source_labels = [ "instance" ];
    target_label = "__param_target";
  }
  {
    target_label = "__address__";
    replacement = "127.0.0.1:${toString catalog.services.blackboxExporter.port}";
  }
];
The first three configs are using regex to parse the format of url;human_name;routing to map them to labels. We then take the newly created instance label and map it to __param_target, which is the endpoint that blackbox will probe against. Lastly we define the exporter address that Prometheus should scrape at, which is the local blackbox instance running at the defined port.
We’ll now need to add this config to the Prometheus scrape configs:
[
  {
    job_name = "blackbox-https";
    metrics_path = "/probe";
    params.module = [ "http_2xx" ];
    static_configs = [{ targets = blackbox.https_targets; }];
    relabel_configs = blackbox.relabel_configs;
  }
]
So now that we have the scrape config that our scraper can use (i.e. VictoriaMetrics), we’ll need to boot up the blackbox exporter so that there’s something to scrape against.
services.prometheus.exporters.blackbox = {
  enable = true;
  port = catalog.services.blackboxExporter.port;
  configFile = pkgs.writeText "blackbox.json" (builtins.toJSON {
    modules.http_2xx = {
      prober = "http";
      timeout = "5s";
      http.fail_if_not_ssl = true;
      http.preferred_ip_protocol = "ip4";
      http.valid_status_codes = [ 200 401 403 ];
    };
  });
};
Visualising and alerting
It’s all well and good having VictoriaMetrics scrape and poll, but let’s use Grafana to visualise all this. I think I sourced it from this dashboard, in either case I’d recommend to use it!
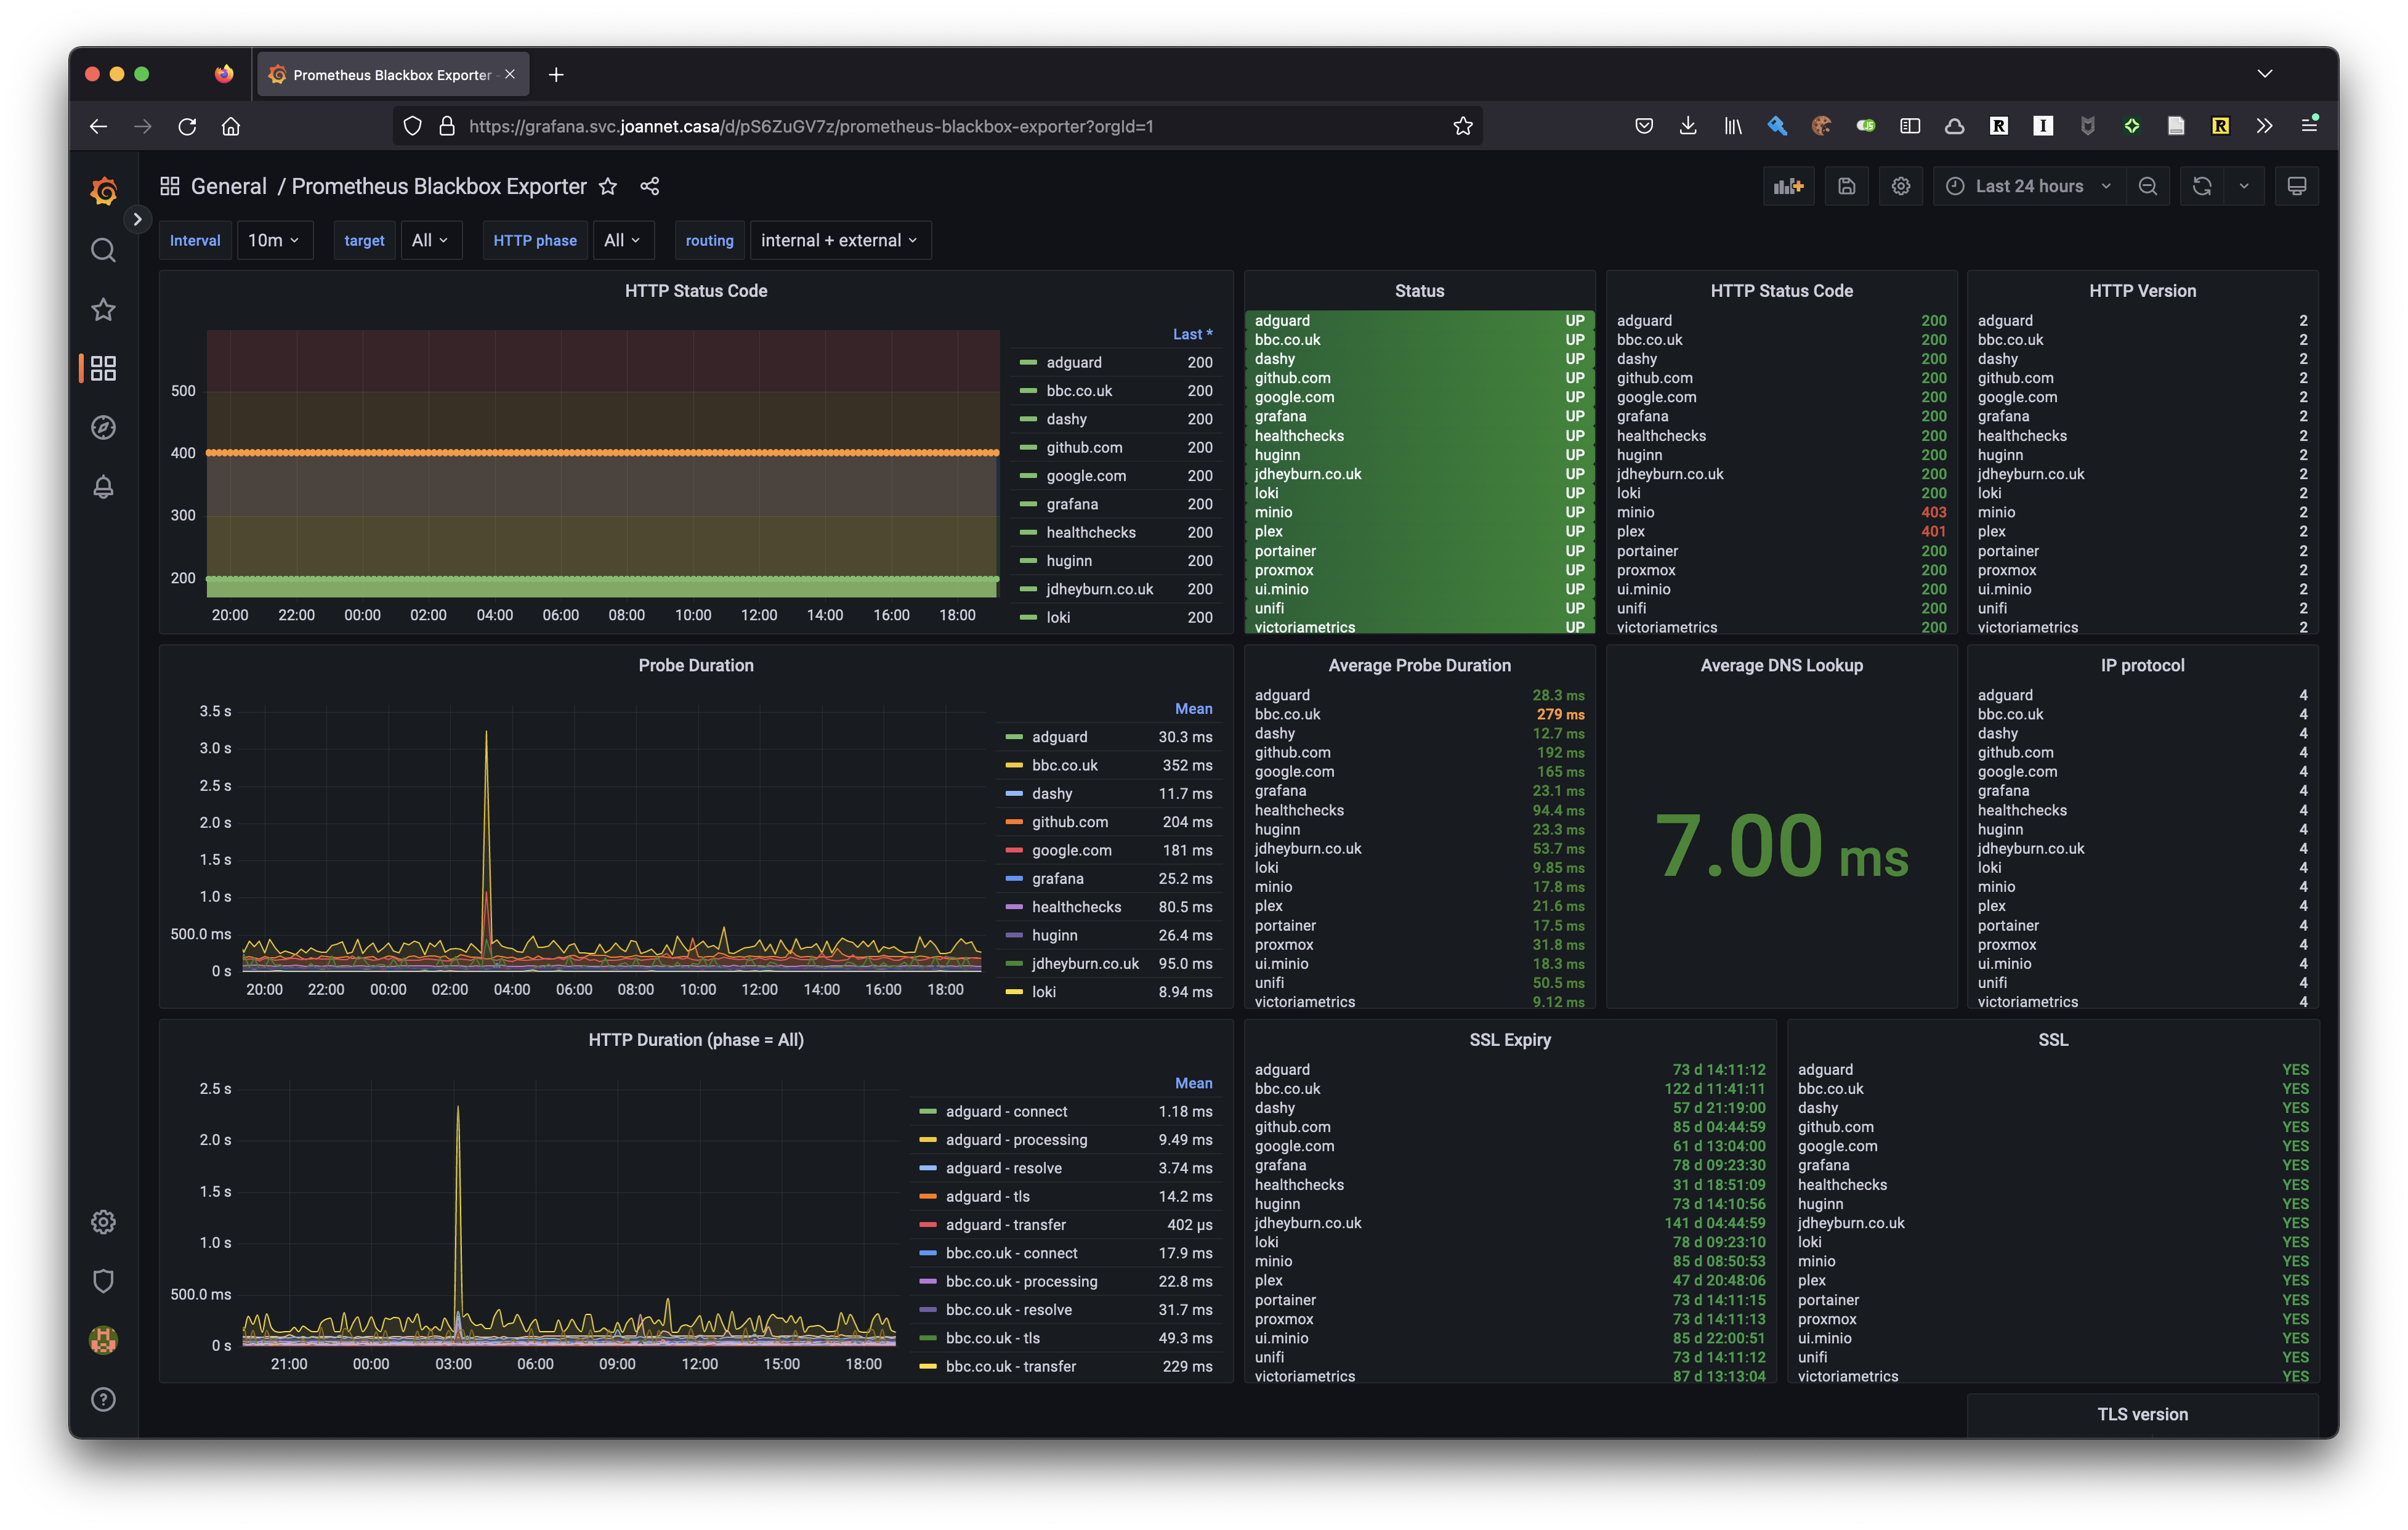
You’ll notice that some services are responding with 4XX codes, this is because the probes are not being authenticated - but I’m getting some response from the service which shows that something is working. These 4XX codes don’t cause a probe to fail, which is down to how I configured the blackbox exporter in the previous section: http.valid_status_codes = [ 200 401 403 ];.
I also have an alert set up in Grafana to alert on the metric probe_success. This metric will report 1 when it was successful, else 0. Given that I want to be alerted when a service has gone down for 5 minutes, I can give the alert a metric query of max by(humanname) (probe_success{routing="internal"}), which will produce a unique metric for each humanname (i.e. service). This is assigned to the variable A.
I’m only interested in alerting on internally routed services, external is out of my control.
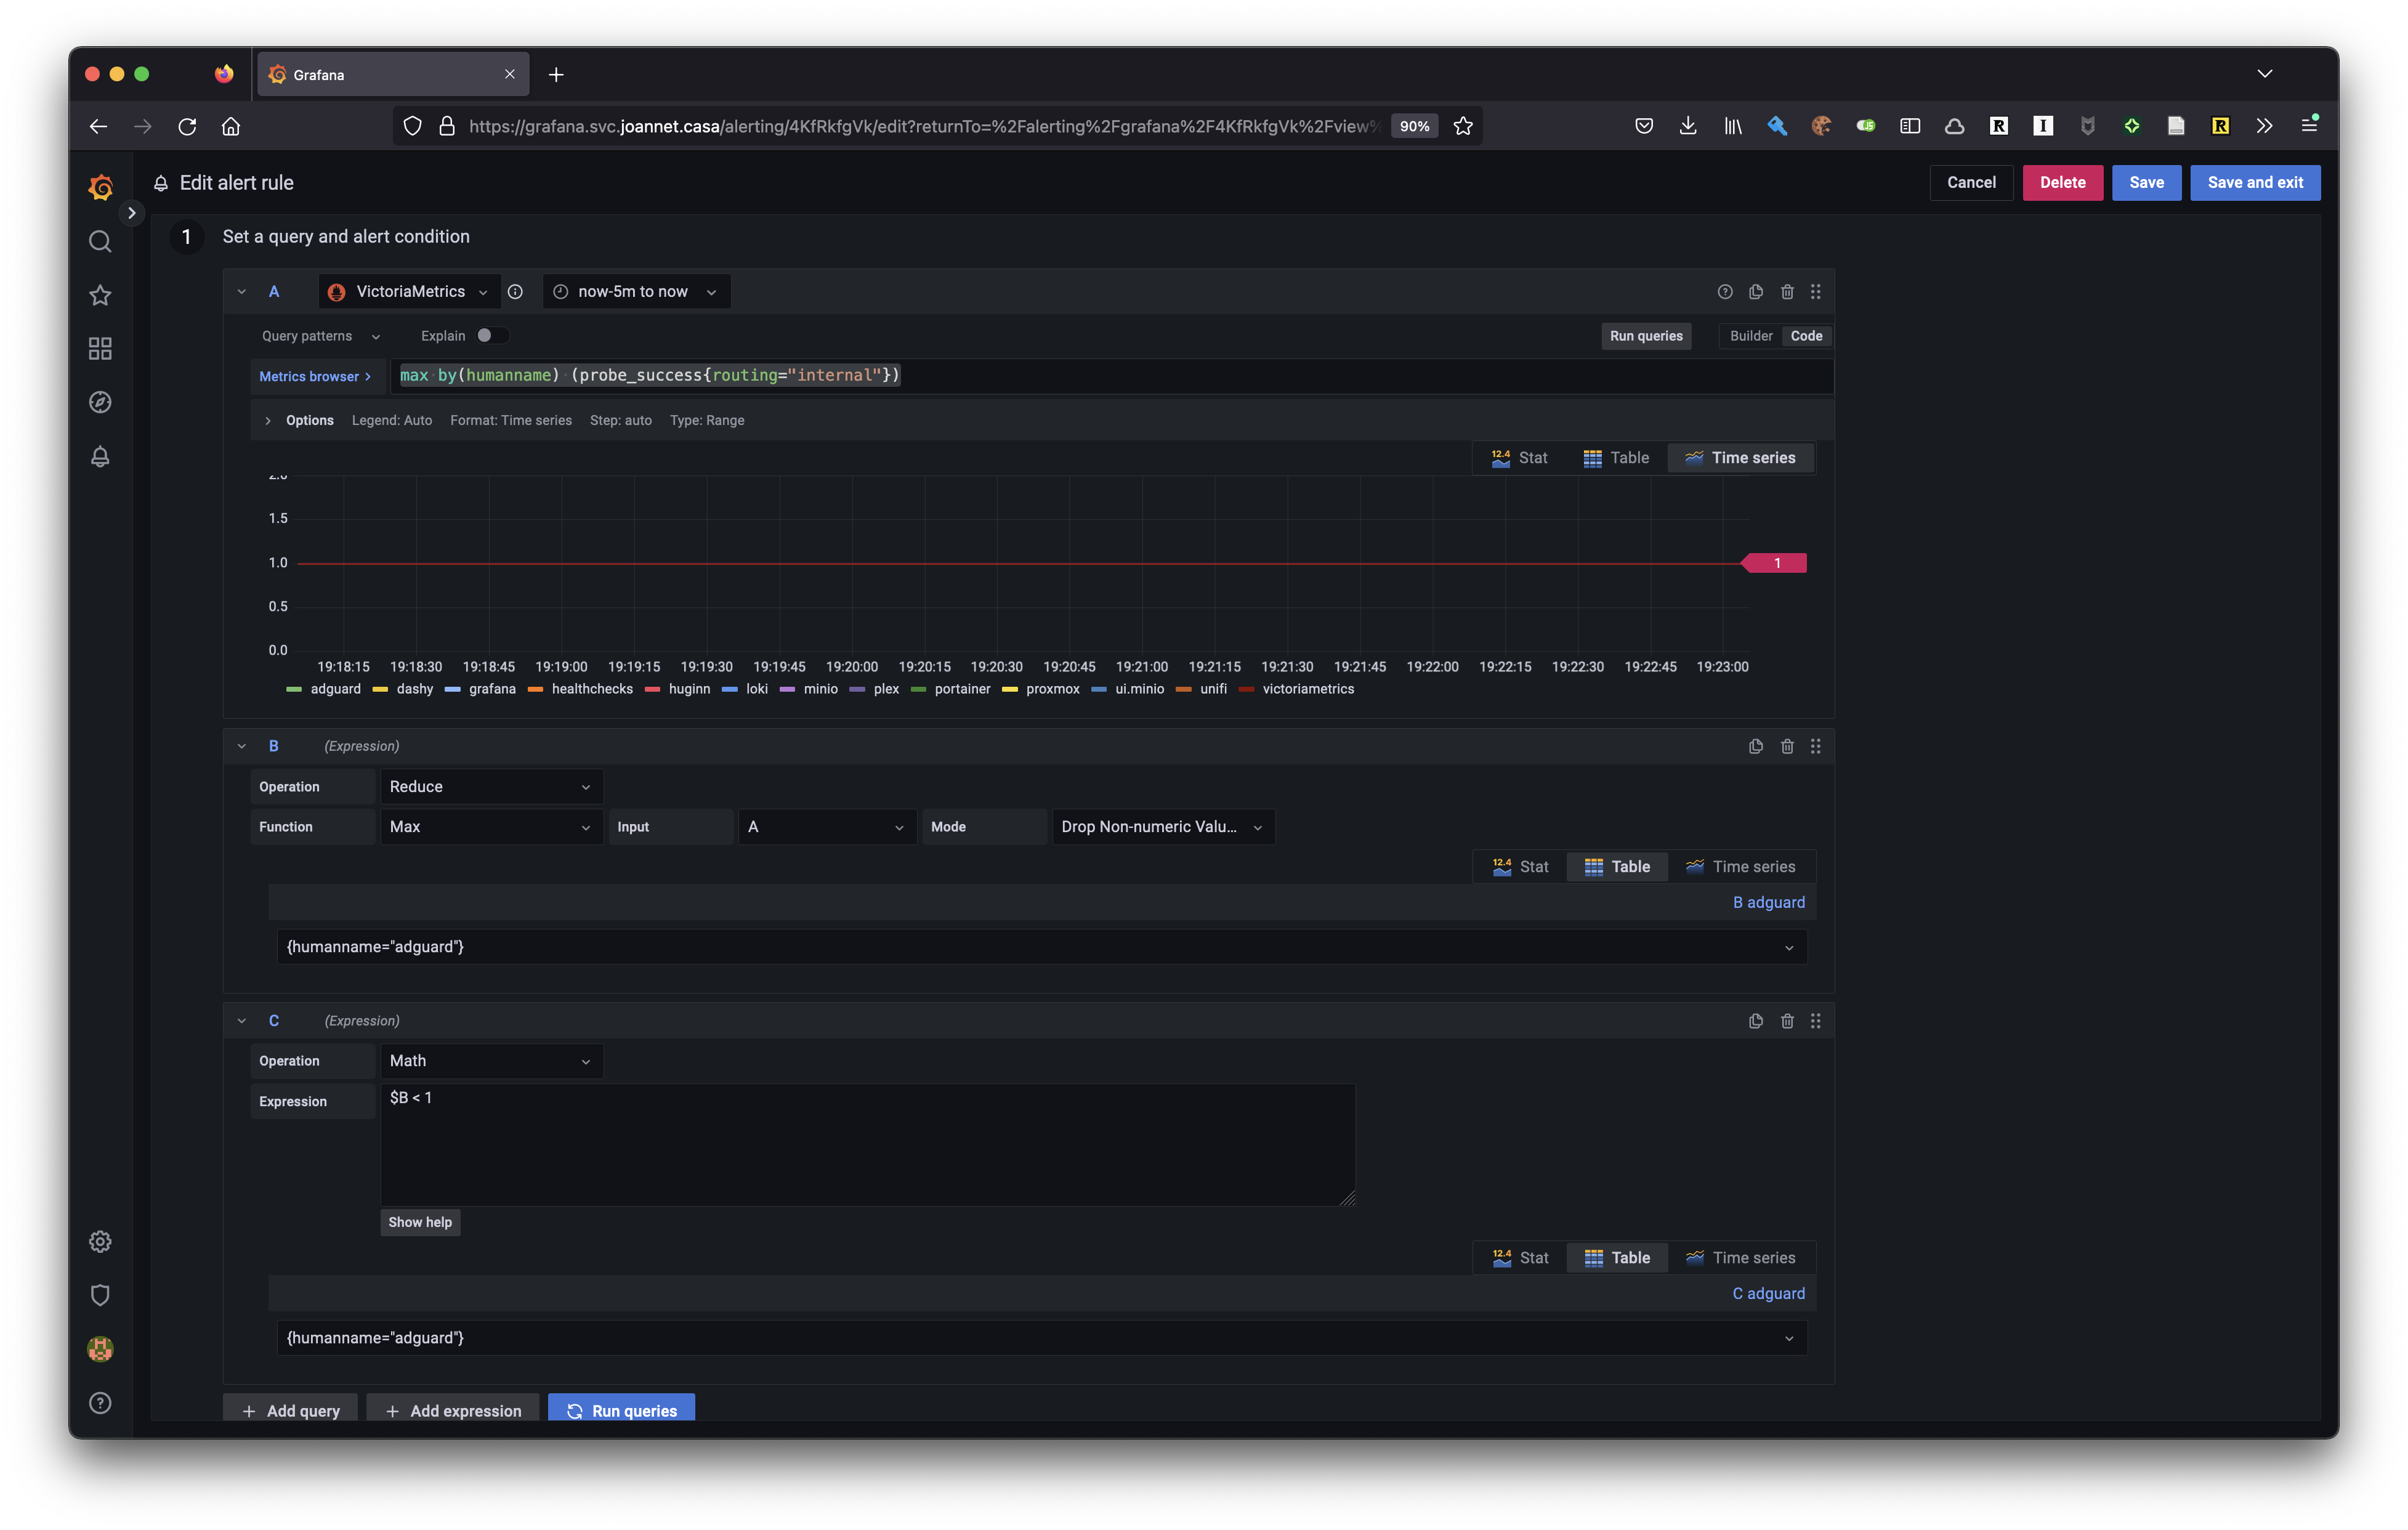
Expression B is then reducing the metric output to a single value, which will be the maximum value for that period.
Lastly expression C checks if B is less than 1, which is what will be produced if the probe failed.
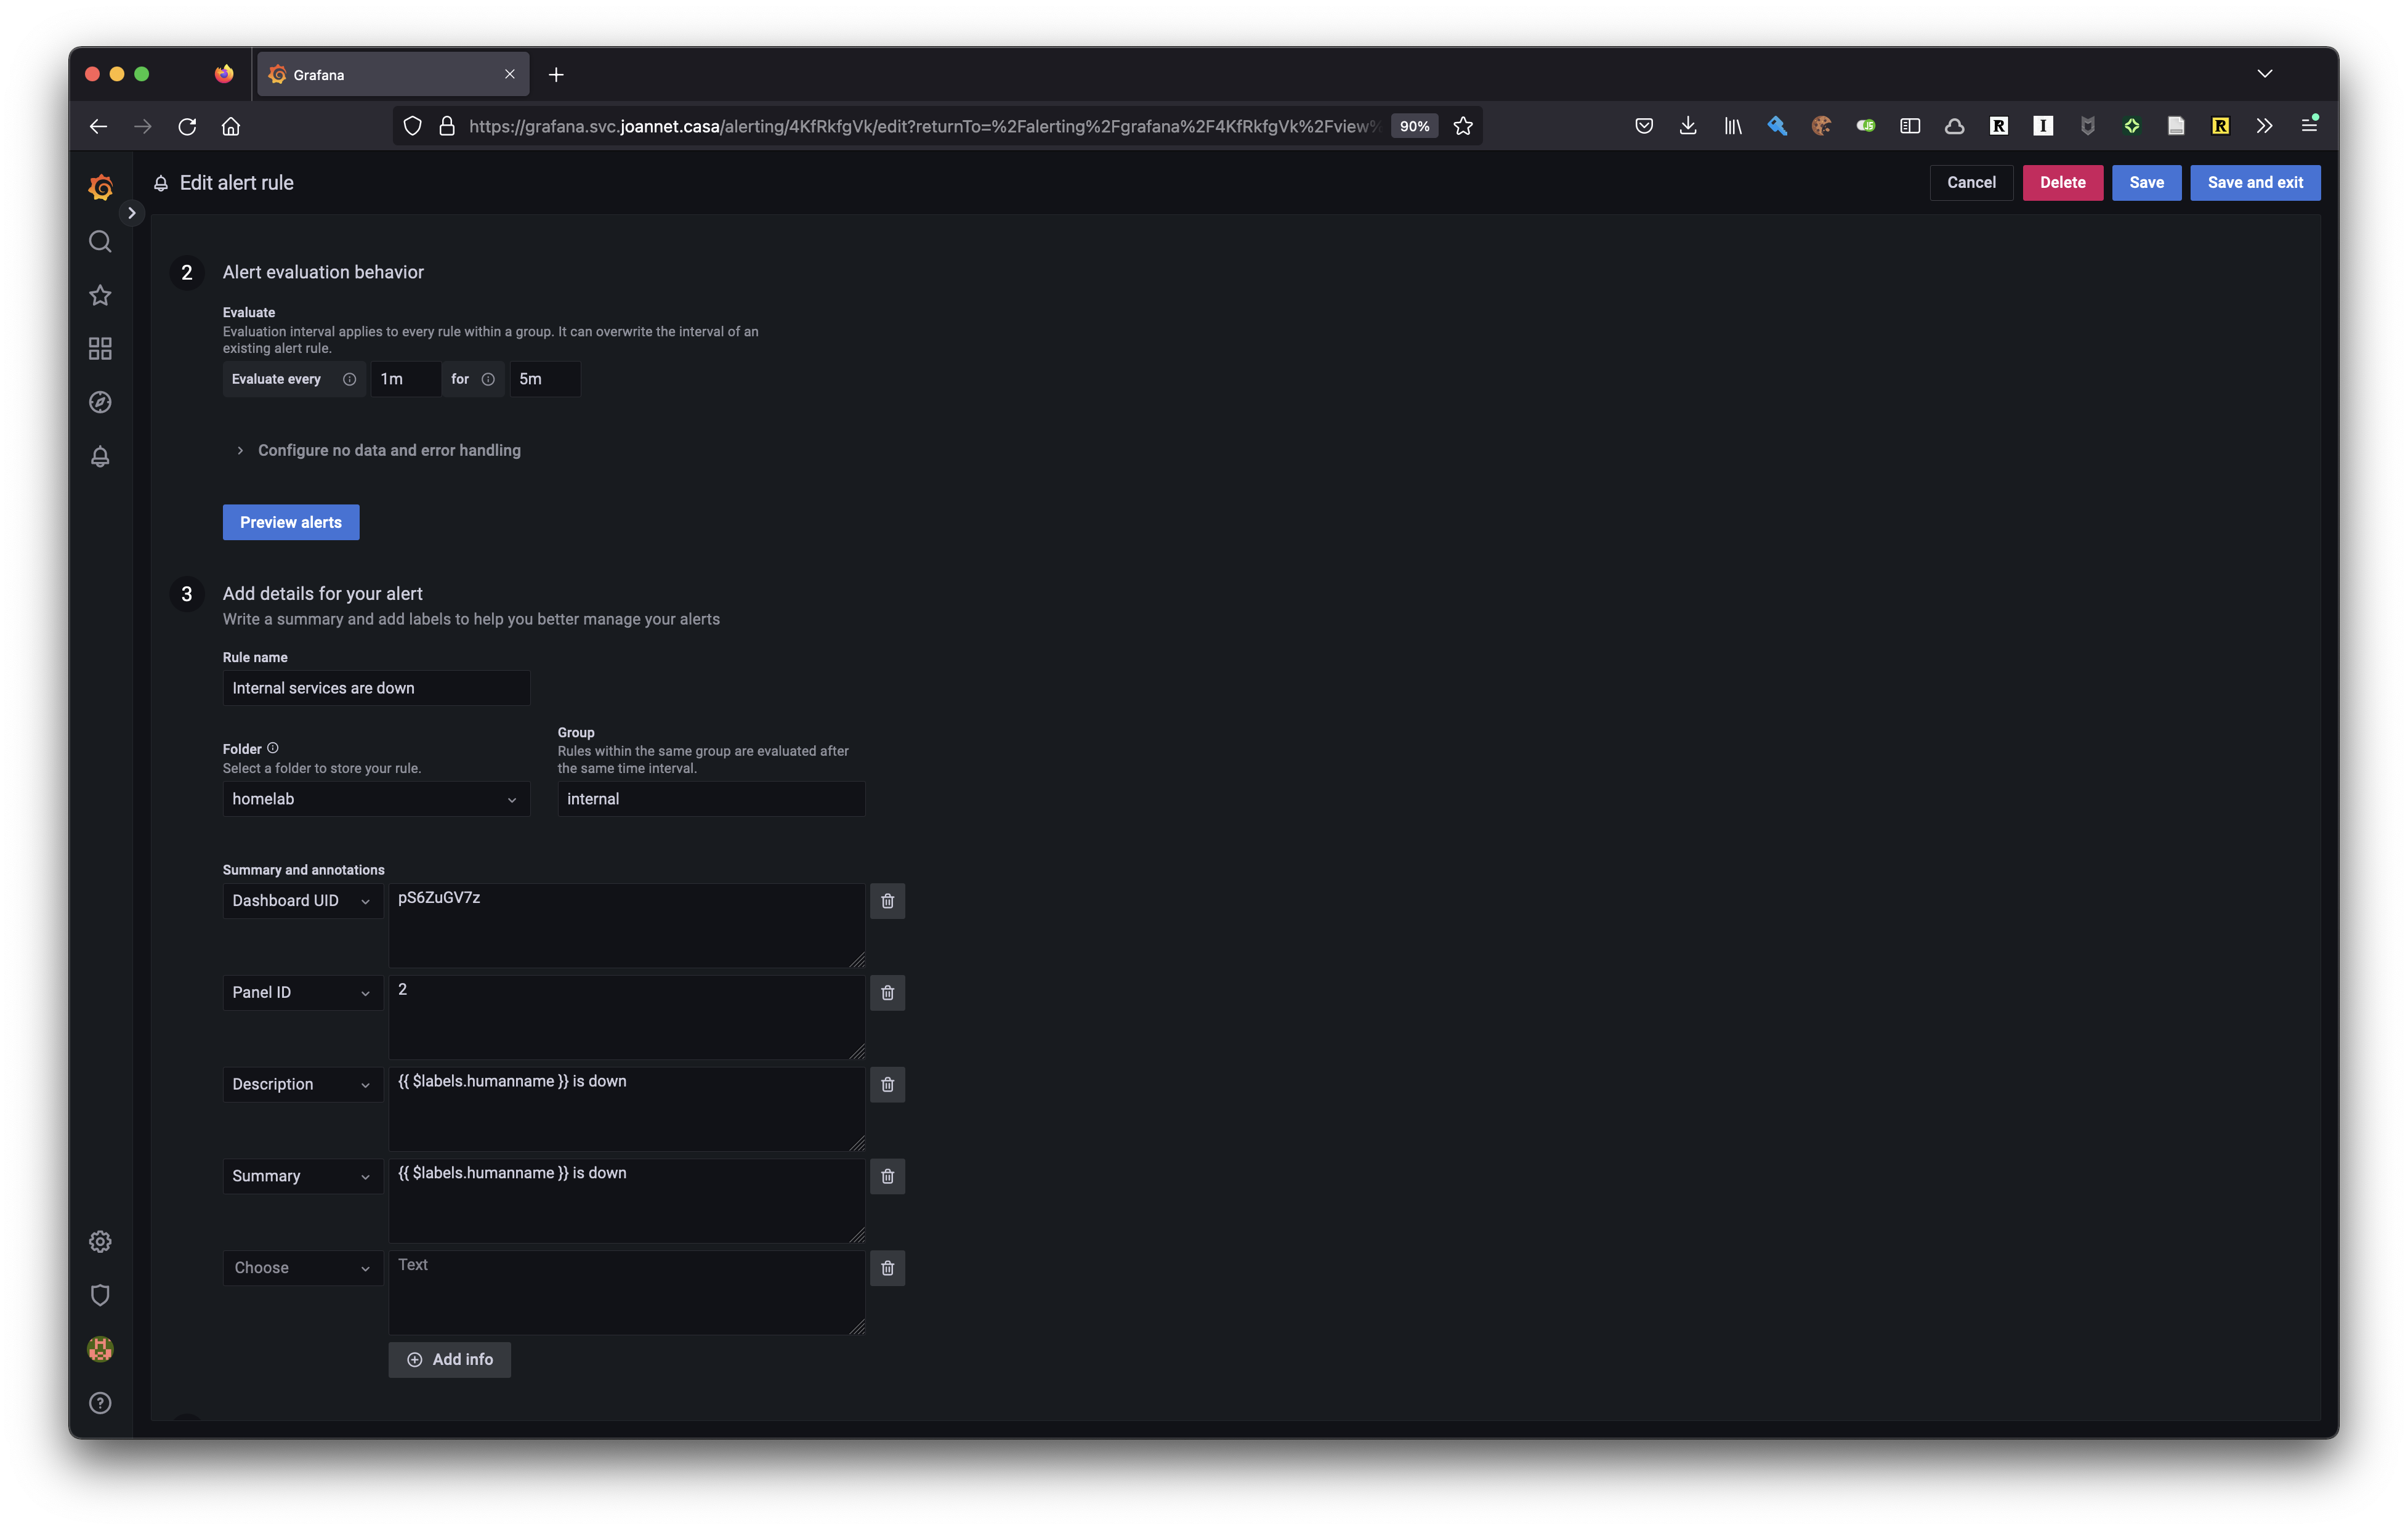
Next up I’m setting how often the alert should poll, and some additional details on the alert, which can be used in the body to link to the blackbox dashboard for diagnosing.
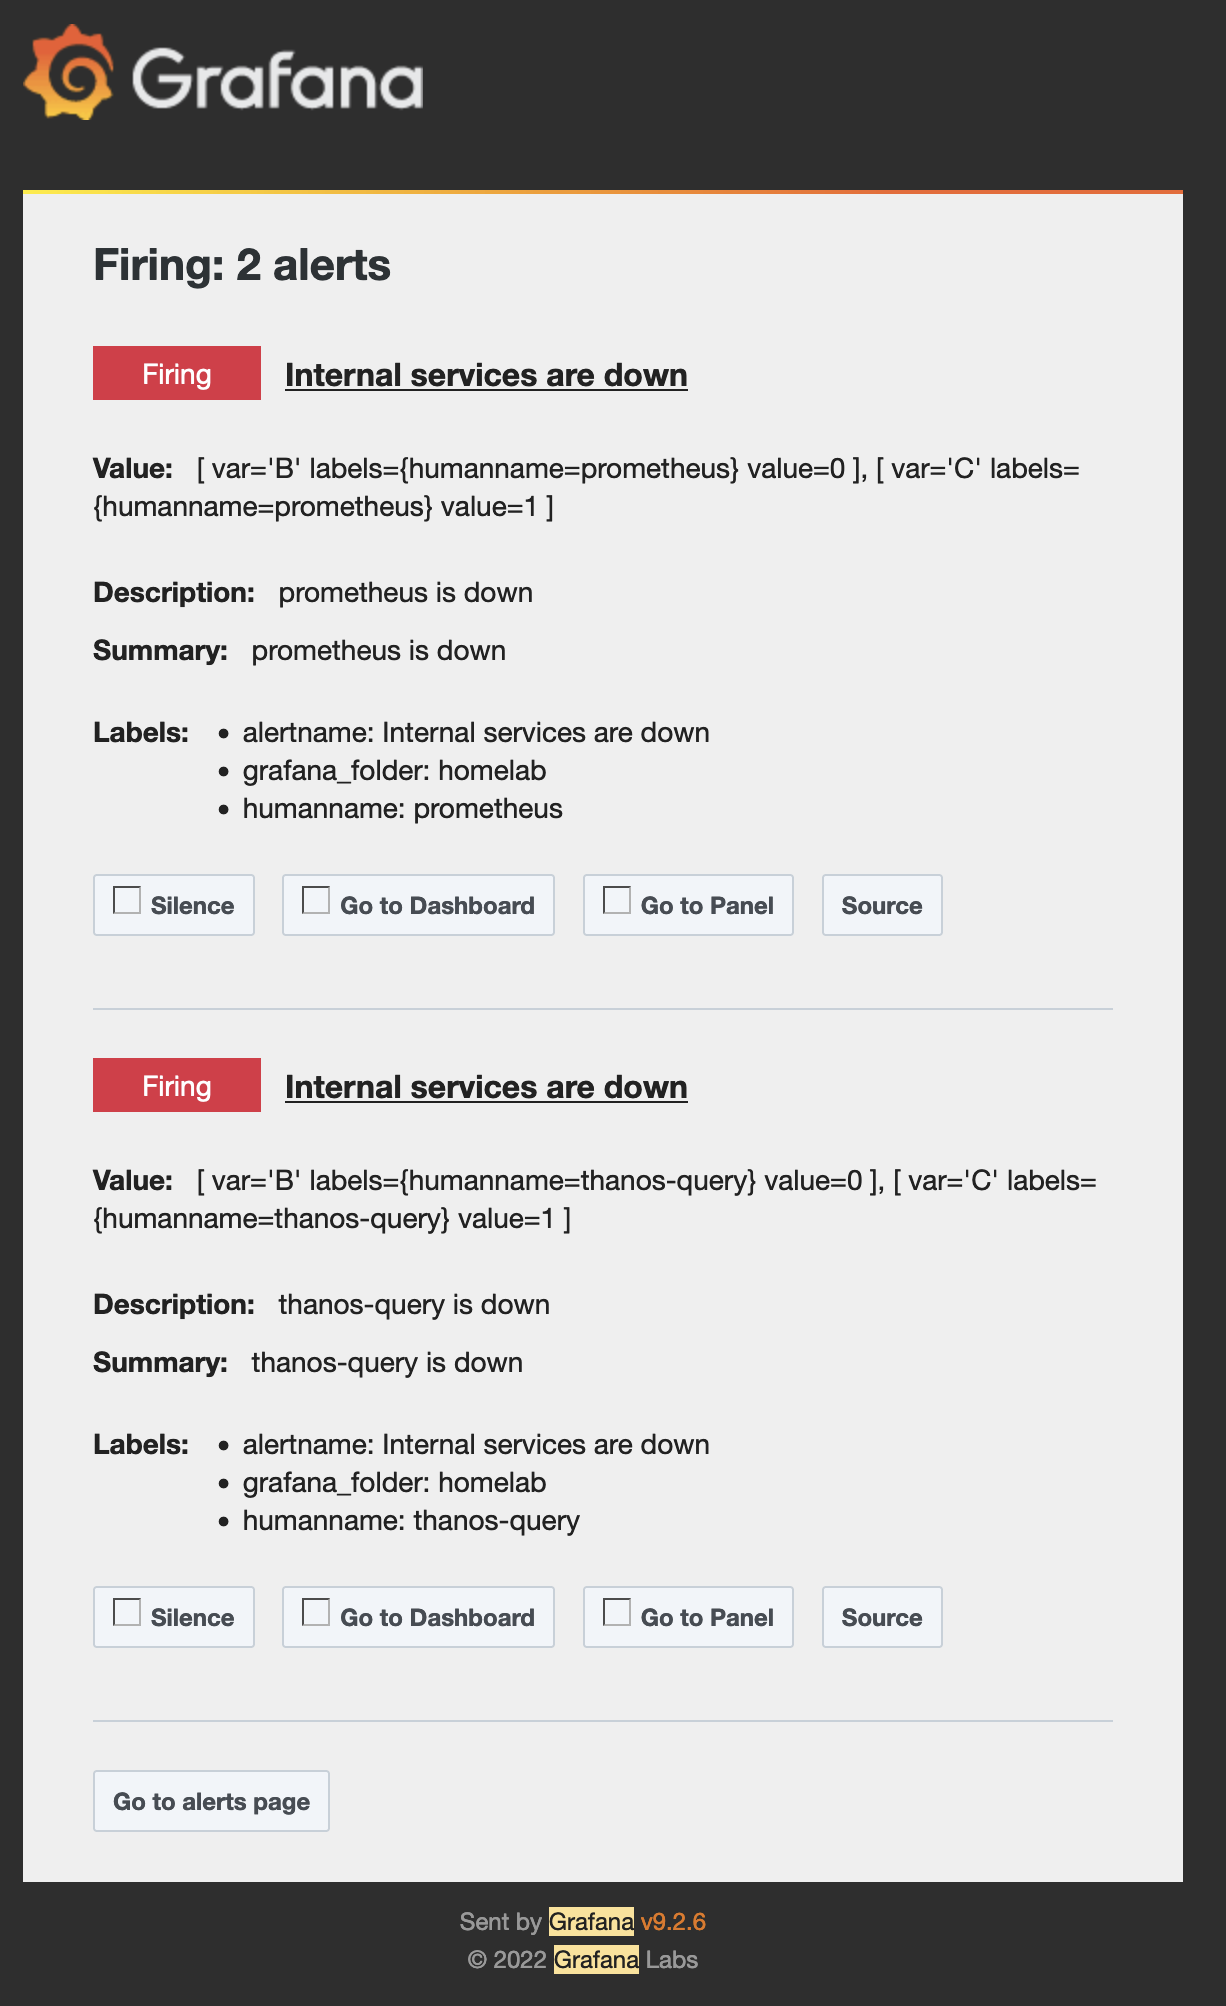
By default all alerts go to my root notification policy, which is to send me an email. I’ve got SMTP set up on my Grafana instance, but I’ll dive into that another time. In the meantime, here’s a screenshot of an email alert!
Dashy
tl;dr: See here for the configuration in GitHub.
Dashy is a customisable dashboard that can act as a homepage for your web browser to help you navigate to services, bookmarks, and more. I’m using it to keep a visual track on the services that I’m running at home.
The desired end result looks like this:
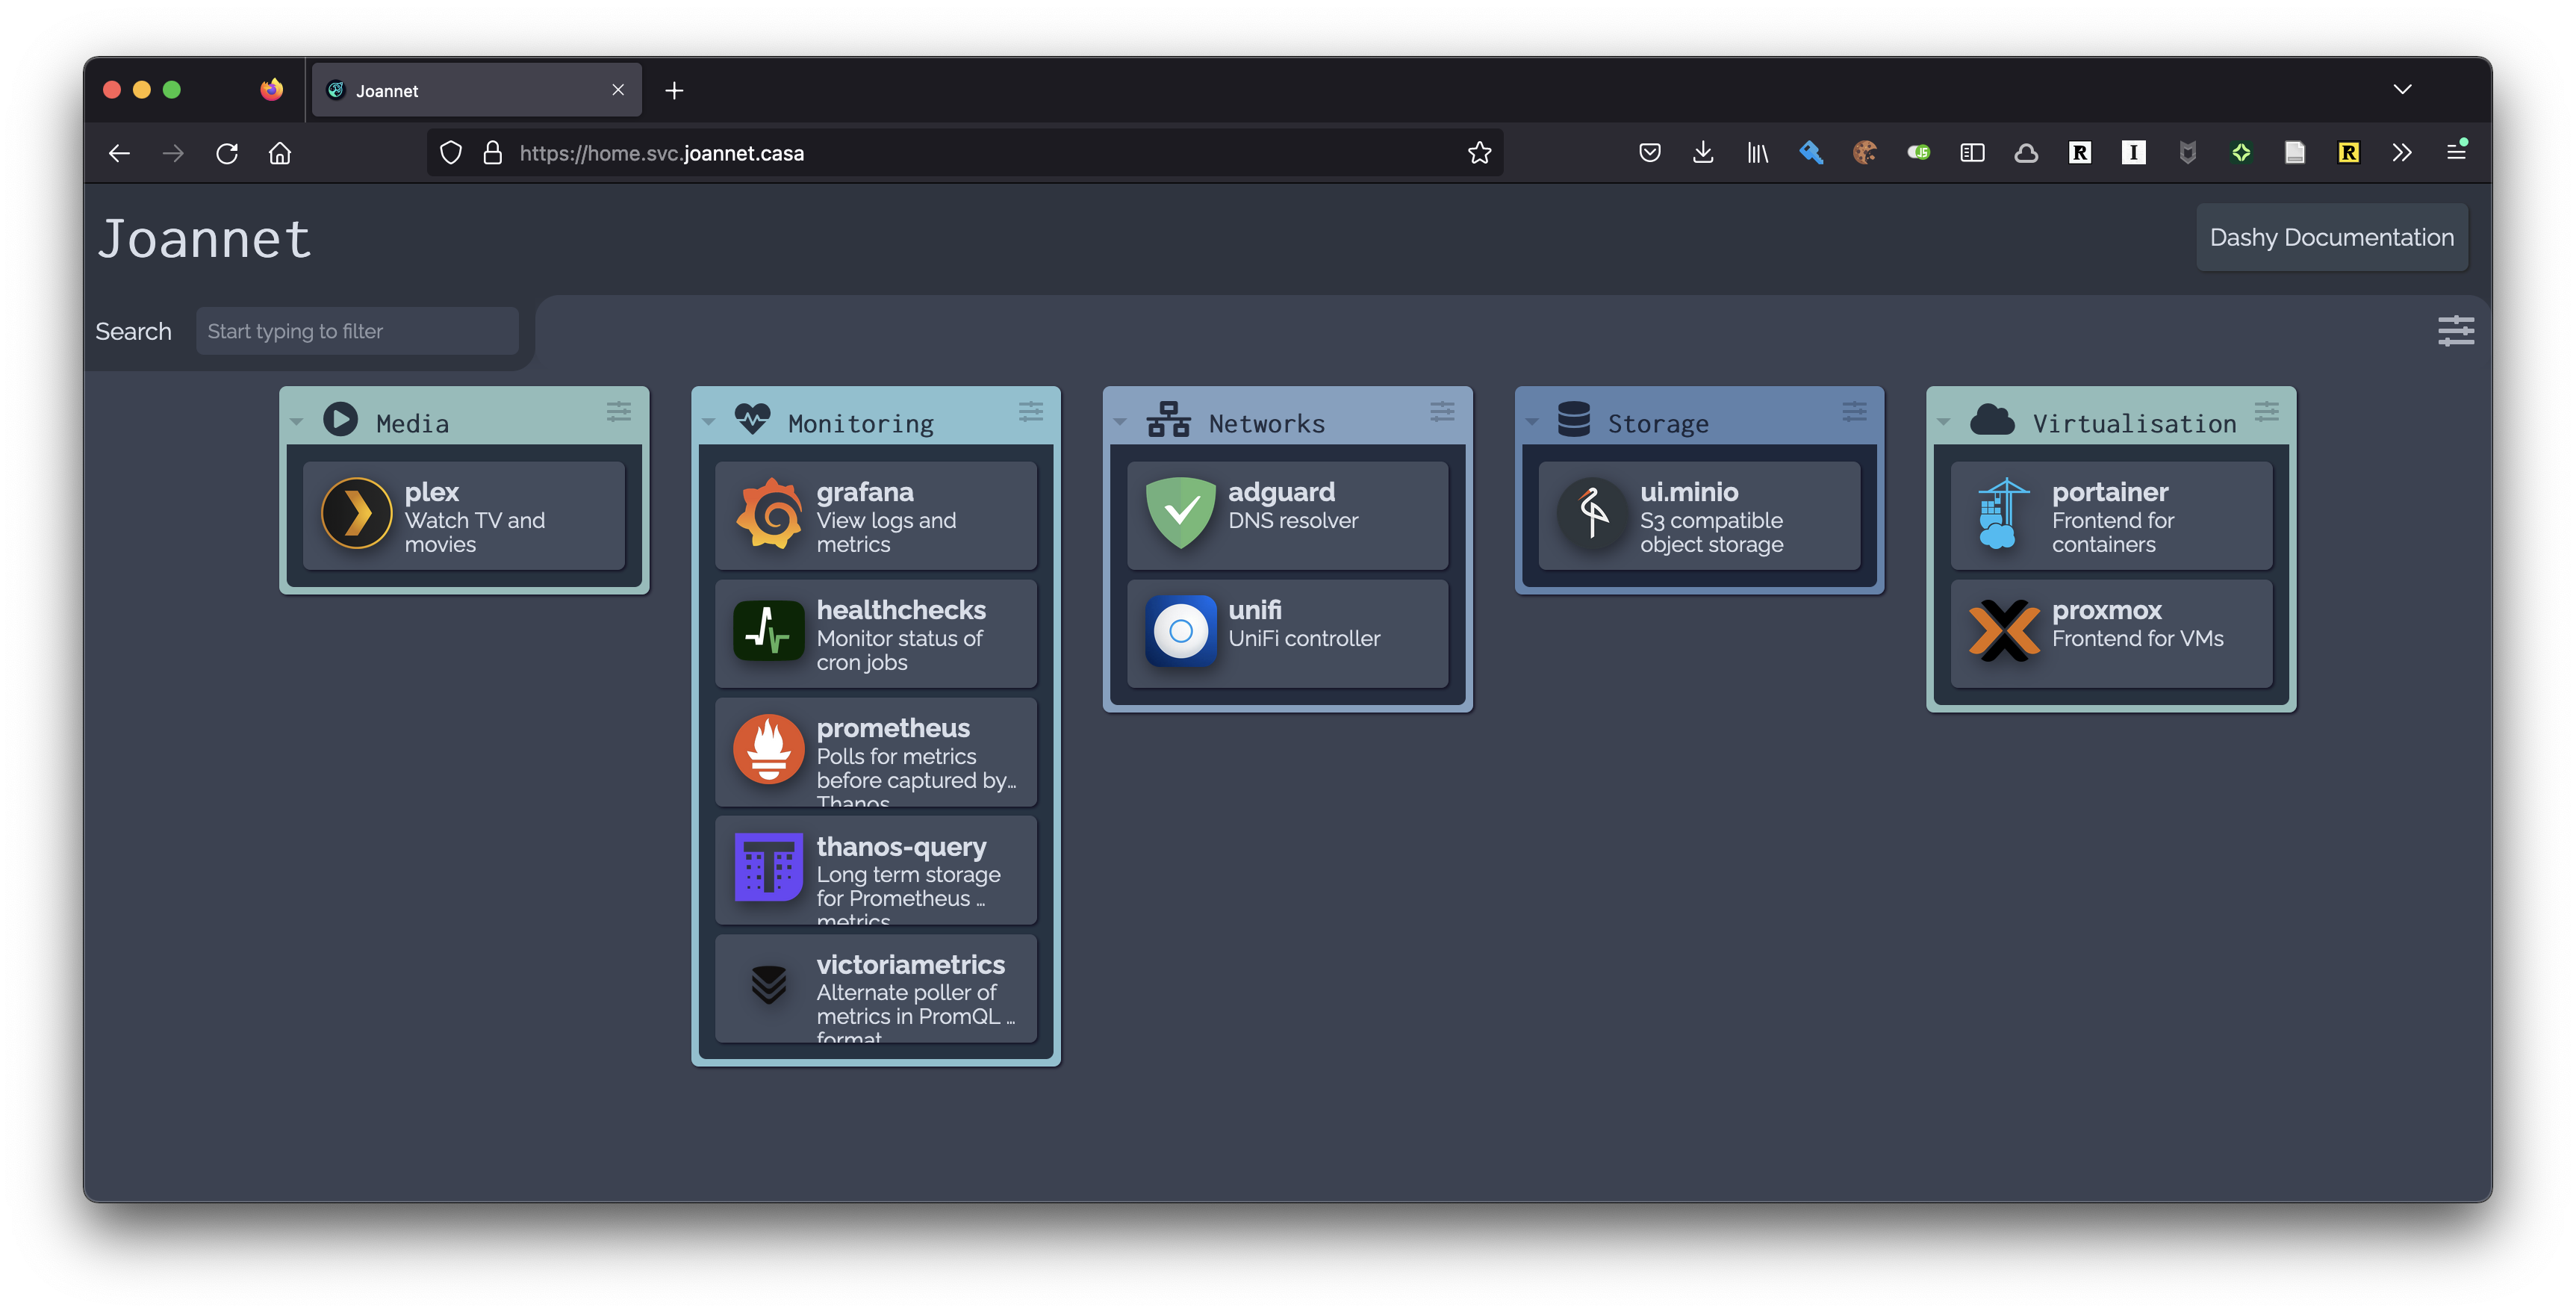
The config for Dashy looks like the below, so let’s get Nix to build it for us!
appConfig:
  # ... removed for brevity

pageInfo:
  title: Joannet
  navLinks:
    - path: https://dashy.to/docs
      title: Dashy Documentation

sections:
  - name: Media
    icon: fas fa-play-circle
    items:
      - title: plex
        description: Watch TV and movies
        icon: hl-plex
        url: https://plex.svc.joannet.casa
  -  # additional sections here
Building Dashy config
We start off with a baseline of sections we want Dashy to look for, since a section requires an icon (the image to the left of the section name in the above screenshot).
sections = [
  {
    name = "Media";
    icon = "fas fa-play-circle";
  }
  {
    name = "Monitoring";
    icon = "fas fa-heartbeat";
  }
  {
    name = "Networks";
    icon = "fas fa-network-wired";
  }
  {
    name = "Storage";
    icon = "fas fa-database";
  }
  {
    name = "Virtualisation";
    icon = "fas fa-cloud";
  }
];
And in what might come across as draw the rest of the fucking owl, we build the sections list…!
sectionServices = let
  isDashyService = section_name: svc_def:
    svc_def ? "dashy" && svc_def.dashy ? "section" && svc_def.dashy.section
    == section_name;

  createSectionItems = services:
    map (service: {
      title = service.name;
      description = service.dashy.description;
      url = "https://${service.name}.svc.joannet.casa";
      icon = service.dashy.icon;
    }) services;

  sectionItems = sectionName:
    createSectionItems (attrValues (filterAttrs
      (svc_name: svc_def: isDashyService (toLower sectionName) svc_def)
      catalog.services));

in map (section: section // { items = sectionItems section.name; }) sections;
Let’s expand on this. Three functions are being defined in this let block:
isDashyService- Returns true we should include this service in the current iterated section
- Service definitions opt-in to what Dashy section they belong to
createSectionItems- For a given list of services, create the item definition for that service as required by Dashy
sectionItems- For the current iterated section:
- filter on services to be added to the section
- convert that to a list
- create section items from it
- For the current iterated section:
Then for each element in sections, enrich it with an items attribute with the output of sectionItems function.
This sectionServices variable is then added to dashyConfig:
dashyConfig = {
  pageInfo = {
    title = "Joannet";
    navLinks = [{
      title = "Dashy Documentation";
      path = "https://dashy.to/docs";
    }];
  };

  appConfig = {
    theme = "nord-frost";
    iconSize = "large";
    layout = "vertical";
    preventWriteToDisk = true;
    preventLocalSave = true;
    disableConfiguration = false;
    hideComponents = {
      hideSettings = true;
      hideFooter = true;
    };
  };

  sections = sectionServices;
};
We’ll then need to convert it to a YAML file. This was a bit tricky to set up, but I sought inspiration from this code block.
format = pkgs.formats.yaml { };

configFile =
  pkgs.runCommand "dashy-configuration.yaml" { preferLocalBuild = true; } ''
    cp ${format.generate "dashy-configuration.yaml" dashyConfig} $out
    sed -i -e "s/'\!\([a-z_]\+\) \(.*\)'/\!\1 \2/;s/^\!\!/\!/;" $out
  '';
Then configFile is exposed to the container where the app is running. You can also see below that the port from catalog is used here to expose the service.
virtualisation.oci-containers.containers.dashy = {
  image = "lissy93/dashy:${version}";
  volumes = [ "${configFile}:/app/public/conf.yml" ];
  ports = [ "${toString catalog.services.home.port}:80" ];
};
Deployment configurations
This next section talks about some more advanced features of Nix, of which introducing them is out of scope for this blog post given its length. I’ll discuss how the catalog is used here and link back a more in-depth blog when it is published.
It’s not just service configurations that use the catalog too - I use deploy-rs to deploy these configurations to NixOS nodes, reading from the node definitions in catalog. Given that various services are interdependent on each other across varying nodes, deploy-rs allows me to deploy all configurations at the same time from one command.
# all hosts
nix run github:serokell/deploy-rs -- -s "."

# per host
nix run github:serokell/deploy-rs -- -s ".#dennis"
deploy-rs requires you to enable Nix Flakes in your config, allowing you to fix all your dependencies to a particular version, with a hash. This ensures that you are always able to reproduce the config no matter what rebuilds you do. It primarily is used for locking dependencies of a particular package, but it can also be used for locking dependencies of NixOS configs.
deploy-rs piggybacks on flakes to define what hosts it should deploy too, requiring a deploy.nodes attrset of hostnames to a definition:
deploy = {
  nodes = {
    dennis = {
      hostname = "192.168.1.12";
      profiles = {
        system = {
          user = "root";
          path = deploy-rs.lib."x86_64-linux".activate.nixos self.nixosConfigurations.dennis;
          sshOpts = [ "-o" "IdentitiesOnly=yes" ];
        };
      };
    };
  };
};
Given that I have node NixOS configurations defined in the hosts directory, I can retrieved the hostnames and use these to poll the hosts defined in catalog.nodes to construct a new attrset that deploy-rs requires.
# Defined earlier in the flake
hosts = builtins.attrNames (builtins.readDir ./hosts);

deploy.nodes = builtins.listToAttrs (map (host:
  let node = catalog.nodes.${host};
  in {
    name = host;
    value = {
      hostname = node.ip.private;
      profiles.system = {
        user = "root";
        path = deploy-rs.lib.${node.system}.activate.nixos
          self.nixosConfigurations.${host};
        sshOpts = [ "-o" "IdentitiesOnly=yes" ];
      };
    };
  }) hosts);
What’s happening here is I’m pulling from the node definitions the IP address used to reach the host, as well as the system architecture for that node, so that we can call the correct deploy-rs library. Lastly I feed it its nixosConfiguration that should be deployed to the node - this is a requirement of using a flake to deploy configs.
While brief, I didn’t want to overload this section with nuances of how flakes are set up. You can see my flake.nix if you are keen to see how it all pieces together.
Conclusion and improvements
I don’t like how I have to define which host the service is running on, I think it would be better to have it so that wherever the modules are enabled, then the catalog discovers that. It’s only a tiny bit of duplication so its not been at the top of my list to improve on.
I’d like to also define as much Grafana configuration as possible using this. I provided a GUI walkthrough of how I set up the alerting, but it would be great to have Nix build this for us instead.
While not largely catalog related, we can extend on home-manager to allow us to be able to use the catalog to deploy Nix configs to non-NixOS nodes. When we do this, we will use the package manager component of Nix (nixpkgs) to manage the packages on a host.
The catalog has been largely beneficial as my source of truth; adding a service in here means that I automatically get an endpoint for it with forwarding, and have it monitored too - plus with easy extensibility to other use cases as they come. It’s also enabled configurations to be read across different hosts, without the use of a service discovery component. It’s one of the benefits of using/experimenting with NixOS of which I’m glad I’ve invested the time in and look forward to playing around with more in future.